By Roberto Guerra, General Director of Business Intelligence (IN)
Storing data is a very common practice in organizations. After all, it is necessary to record everything that happens in the corporate environment in order to create a consistent history that can structure the organization's future planning. But reading this data and seeing answers is not always an easy task.
Generally, large databases of content are accumulated by companies, but in recent decades, with the digitization of all company information, a gigantic mass of disconnected information has been created, making it more difficult not only to search for consistent and strategic data, but also the way they are deciphered.
When we want to understand problems and find solutions, analyzing organizations' information base is extremely vital. This data connects the dots we never imagined could be connected, and provides us with answers to important questions about the company's core business and the strategies to be followed for its growth.
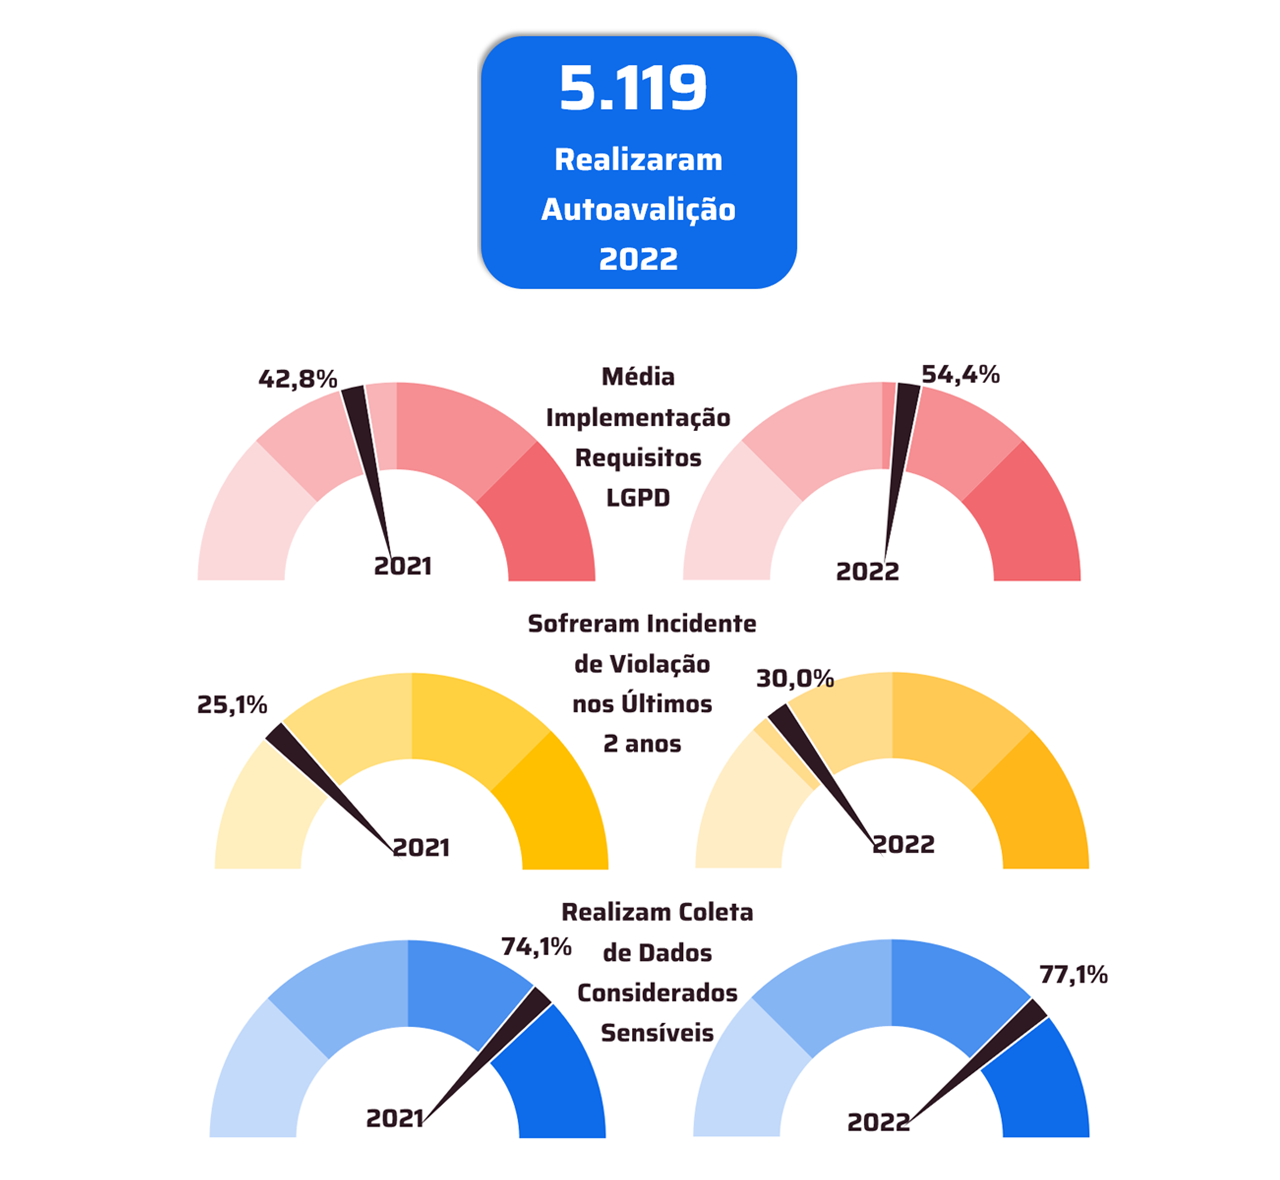
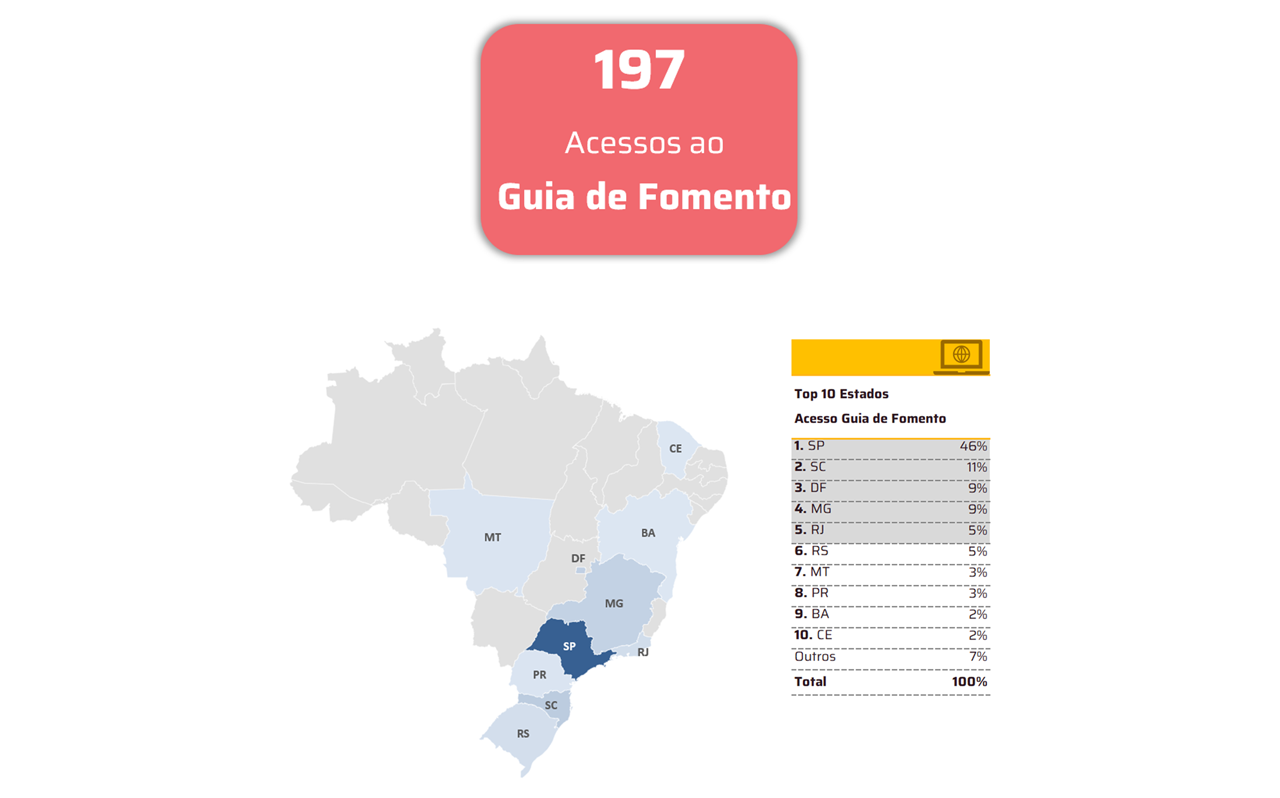
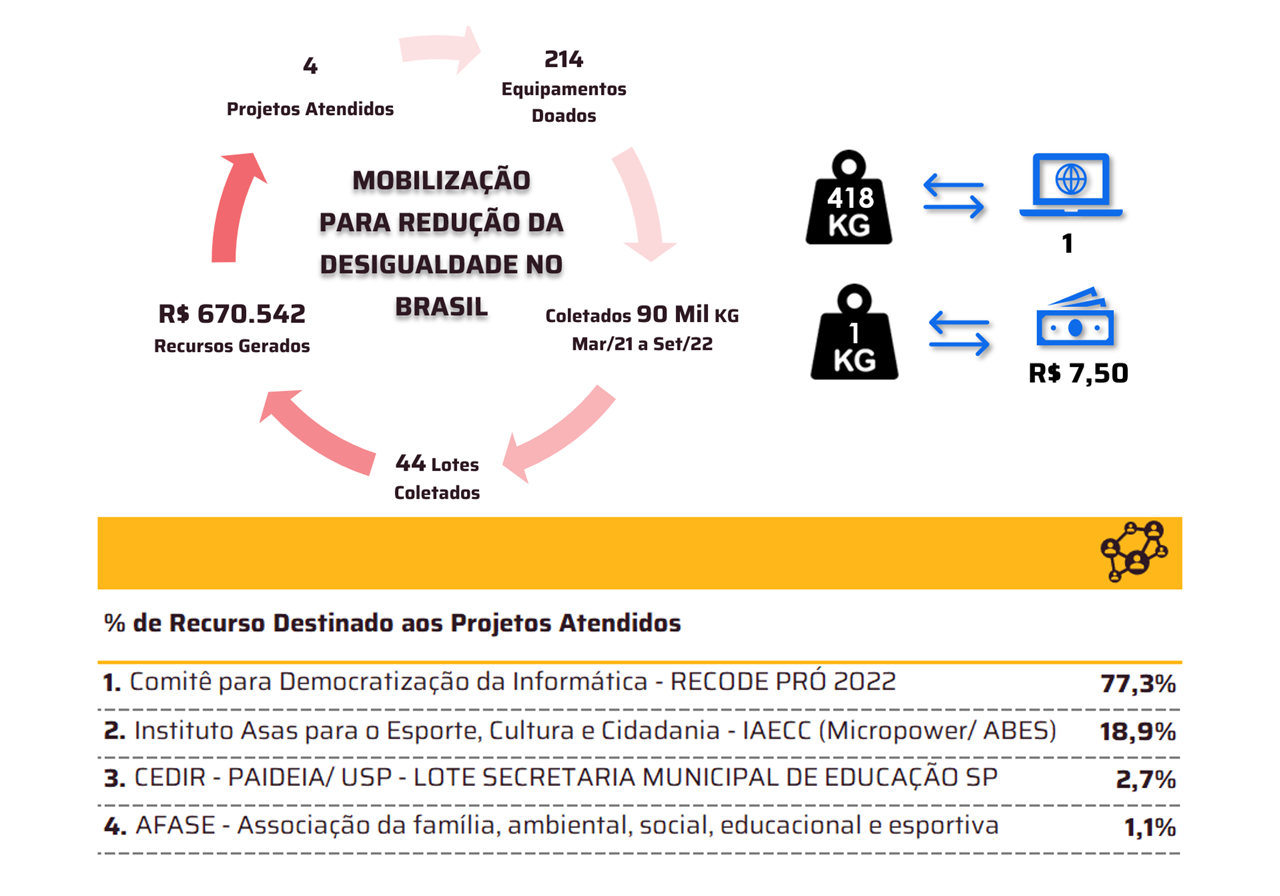
From there, they are transformed into infographics and the indicators provided by this can be told through one in a simple story, leaving the leadership or managers with the mission of reading, understanding and applying the “moral” of the story in strategic decisions for the company. company. This is the origin of the Data Storytelling phenomenon.
But you must be wondering: what is the real difference between Data Storytelling and data analysis?
Currently, there are several tools that fulfill the role of analyzing data well, but with the dynamics of the market and the increasing demand for quick answers, companies have been looking for instruments that provide a complete analysis, including resources for creating dynamic presentations. and easy to understand.
Data Storytelling is the result of what we call a complete package: a solution that is able to analyze data, cross them and also have an interface that allows the construction of visual presentations. With this, decision makers can use only one platform to understand the scenario, perform predictive analysis and present information with foundation and practicality.
So, interpreting the information and knowing how and where to use it is the hardest part of the equation. Understanding this difficulty arises in the market this trend that came to simplify the analysis and understanding of information through a story. The idea is that it can help the company's board to understand the past and present of the business, promoting directions for them to decide how they want the future to be.
The conclusion to be drawn is: as essential as analyzing the high range of current data is knowing how to interpret and use them in an effective and beneficial way, while also being able to optimize time and reduce costs.


