Adoption of Cloud Computing grows by around 50% in 2016, says ABES study
For the first time, the study brings the analysis and percentage evolution of use of the three main trends in the Information Technology sector: Cloud Computing, Internet of Things (IoT) and Big Data. “With Digital Transformation having such a strong impact on business, we think it is important to bring data from the main technologies and their impacts on the market to the study”, says Jorge Sukarie, chairman of the board of ABES.
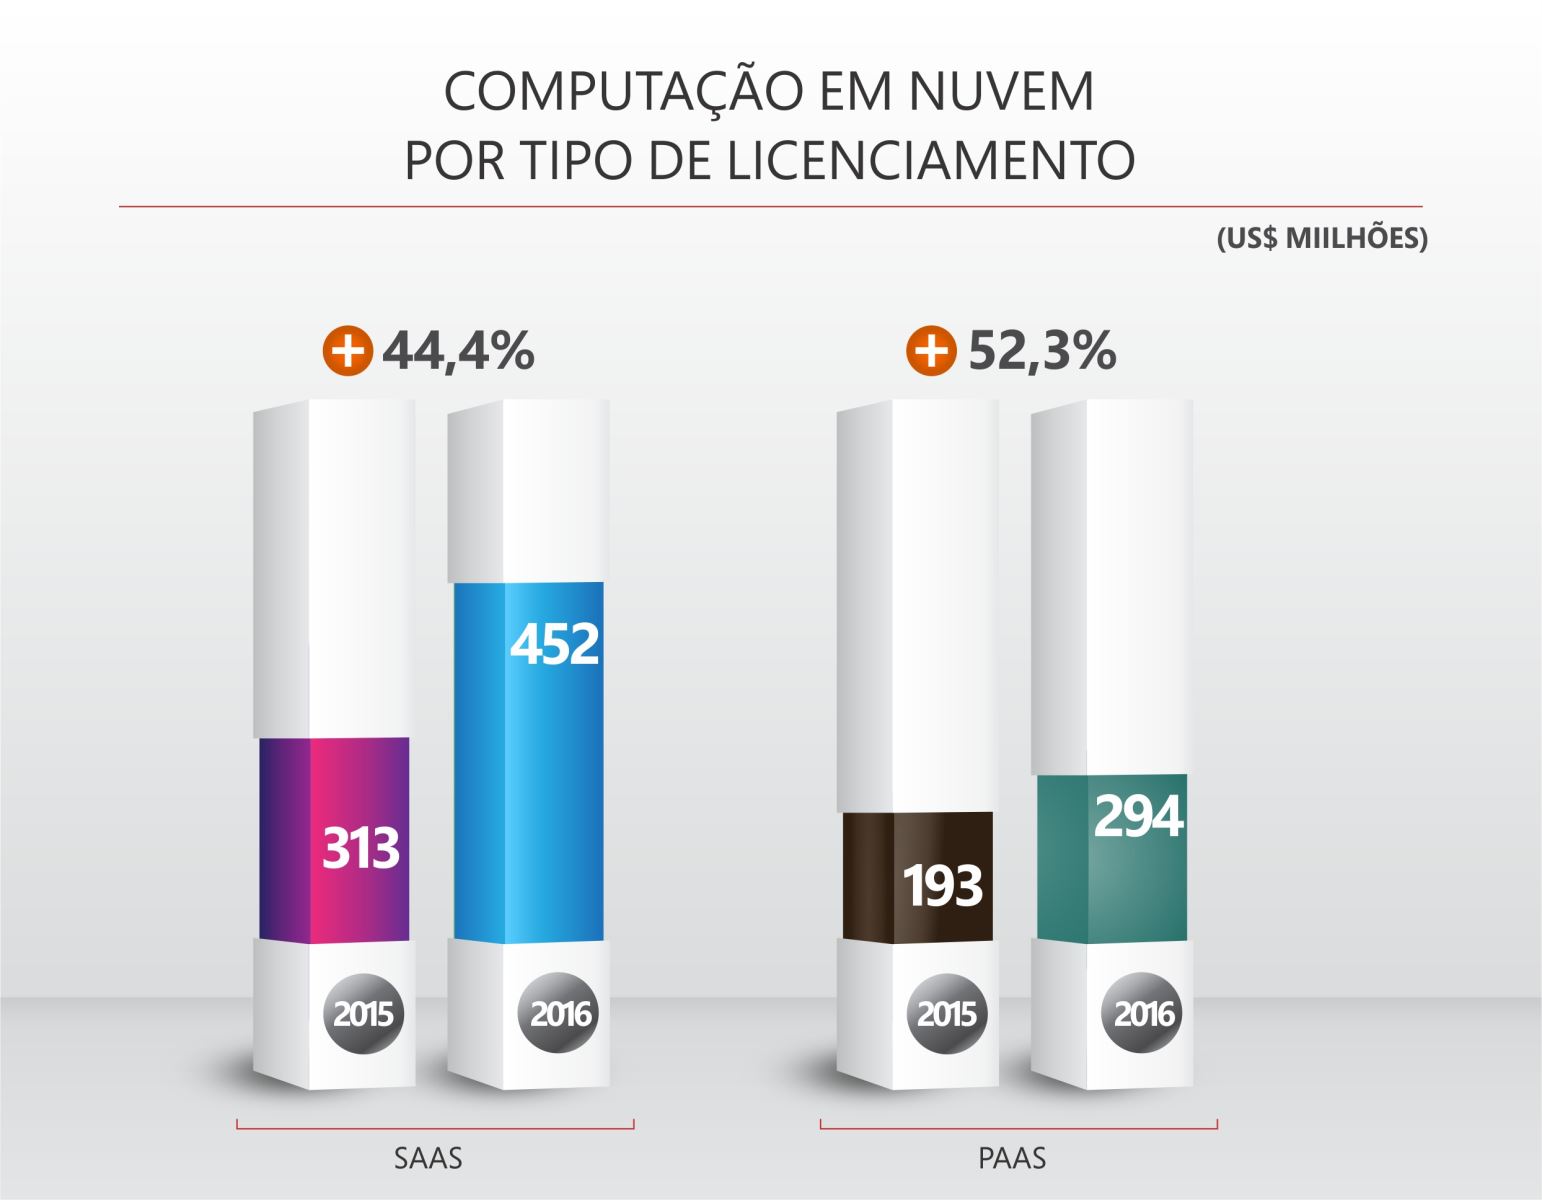
In 2016, the cloud computing market expanded by 47.4%, based on the two main services in the sector (SaaS and PaaS). Investments in this type of licensing increased from US$ 506 million in 2015 to US$ 746 million the following year.
According to the survey, the usage model that grew the most was that of Collaborative Applications, where cloud usage surpassed traditional licensing, representing in 2016, 53.3% of the market - an increase of 133% compared to the number registered in 2013. The applications that showed the second highest growth were CRM, where, despite traditional licensing representing the majority of the market, cloud usage jumped from a share of 20.8%, in 2015, to 27.5%, in 2016.
DATA APPLICATION
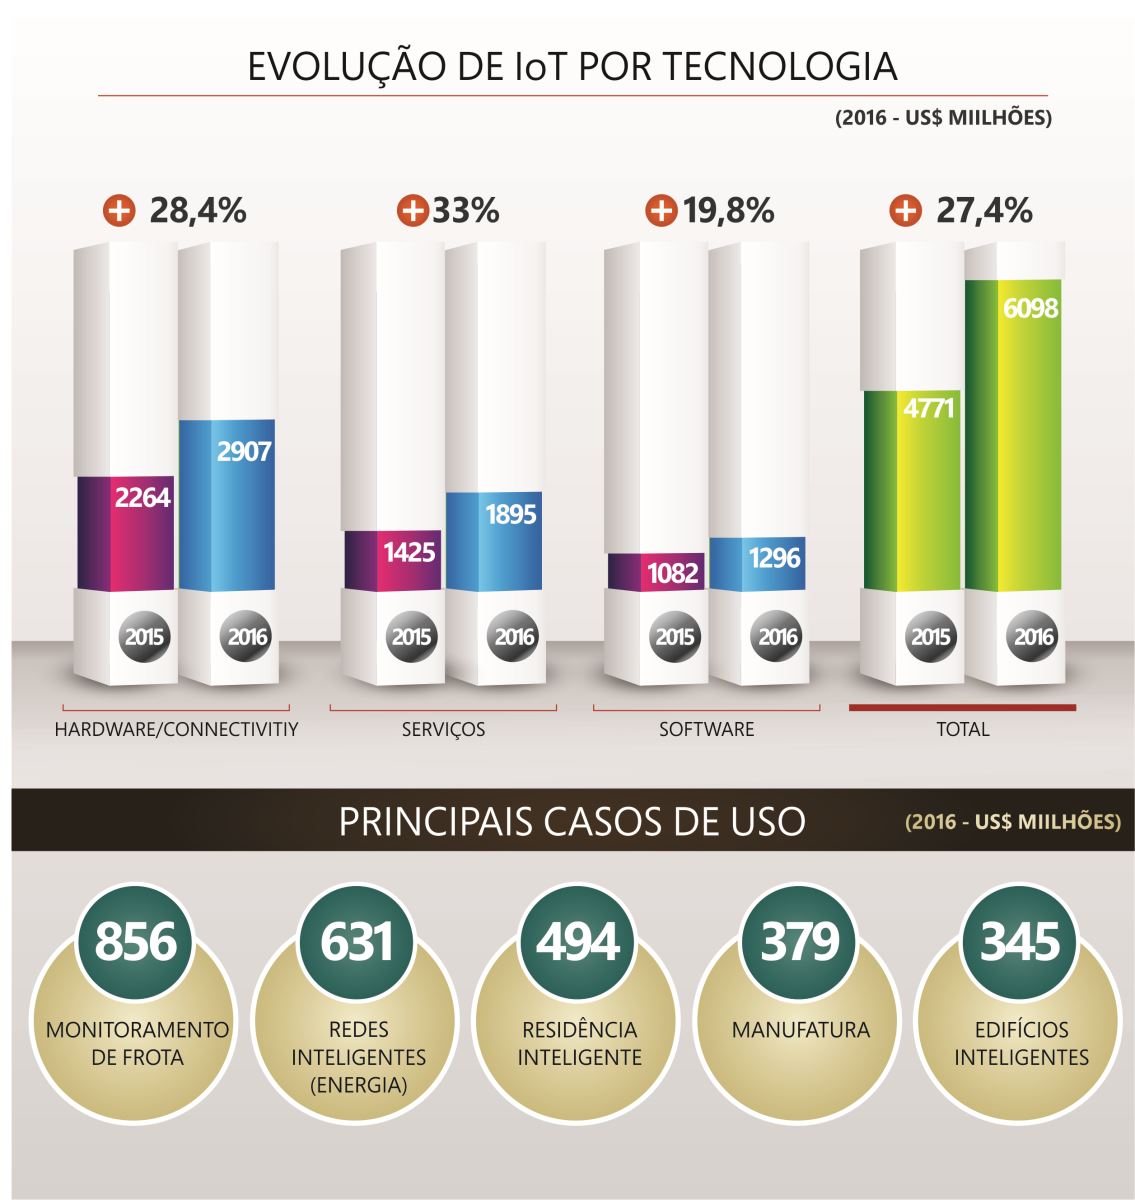
Another highlight is the wide expansion of the Internet of Things (IoT), which grew by 27.8% and reached investments of US$ 6 billion, and in Brazil, the main use cases are in Fleet Monitoring, which invested US$856 million , followed by Smart Grid, with US$ 631 million. “IoT is intrinsically connected with reinventing business as we know it today. This is such a relevant topic that there are discussions in the government to identify areas in which Brazil can excel within the IoT and, with that, be able to establish ways to support research, development and innovation”, comments Jorge Sukarie.
At the other end of this process is the analysis of the data so that it can be used in applications in the most diverse areas. Despite the growth of Big Data and Analytics following at a slower speed with an increase of 3.2%, it totaled US$ 809 million in 2016. that a Big Data solution does not fit and that it is possible to generate results that can speed up decision-making, making them more assertive and bringing greater productivity and competitiveness”, points out Sukarie.
INVESTMENTS BY ECONOMY SECTORS
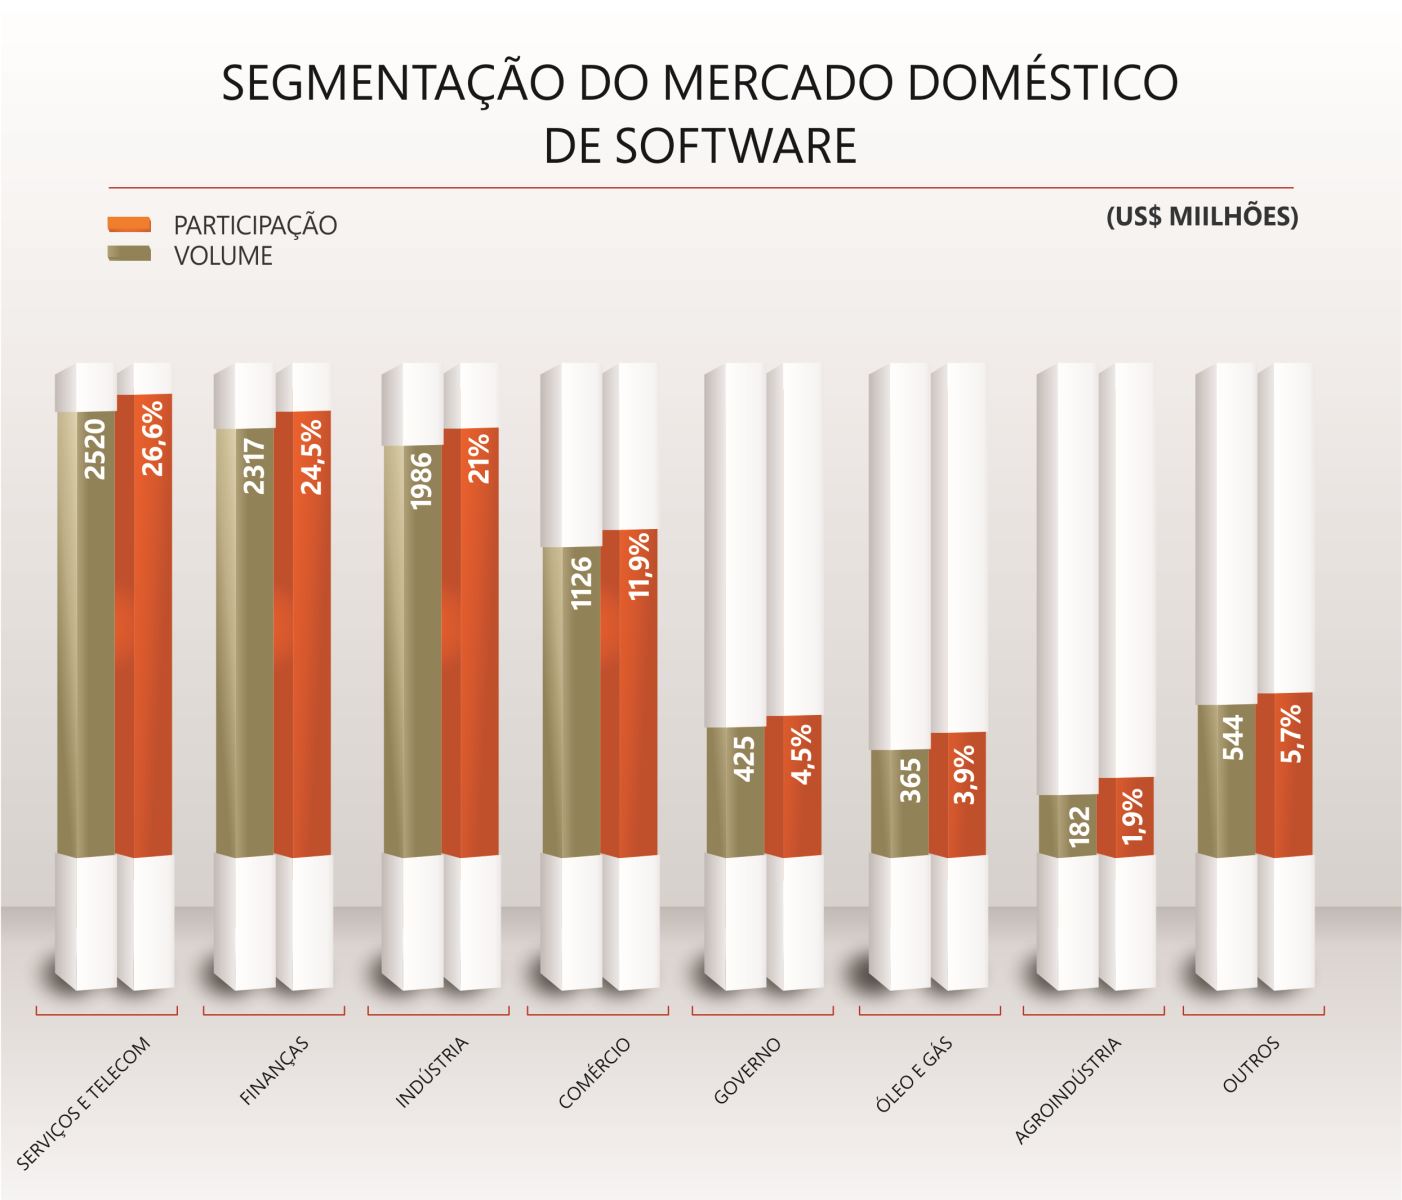
The sector of the economy that invested the most in Software, in 2016, was Services and Telecommunications (investment of US$2.5 billion and growth of 3.6%, compared to the previous year), while the one that most reduced investments was Finance, with a drop of 2.9%, but still responsible for 24.5% of market share compared to 26.6% for Services and Telecommunications. In third place comes Industry which, with investments of around US$ 2 billion, has a share of 21%, followed by Trade, Government and Oil/Gas, representing 11.9%, 4.5% and 3.9%, respectively. Agroindústria, on the other hand, showed a reduction of 1.5% in investments in Software, but the record grain collection scheduled for 2017 should reverse this situation this year.
SECTOR COMPANIES
Currently, the Software and Services Market has 15,707 companies, 11,237 of which are dedicated to the development and sale of software and 4,470 are dedicated to IT services. Among the 4,872 companies dedicated to software development, more than 95% are considered micro or small, that is, with less than 99 employees.
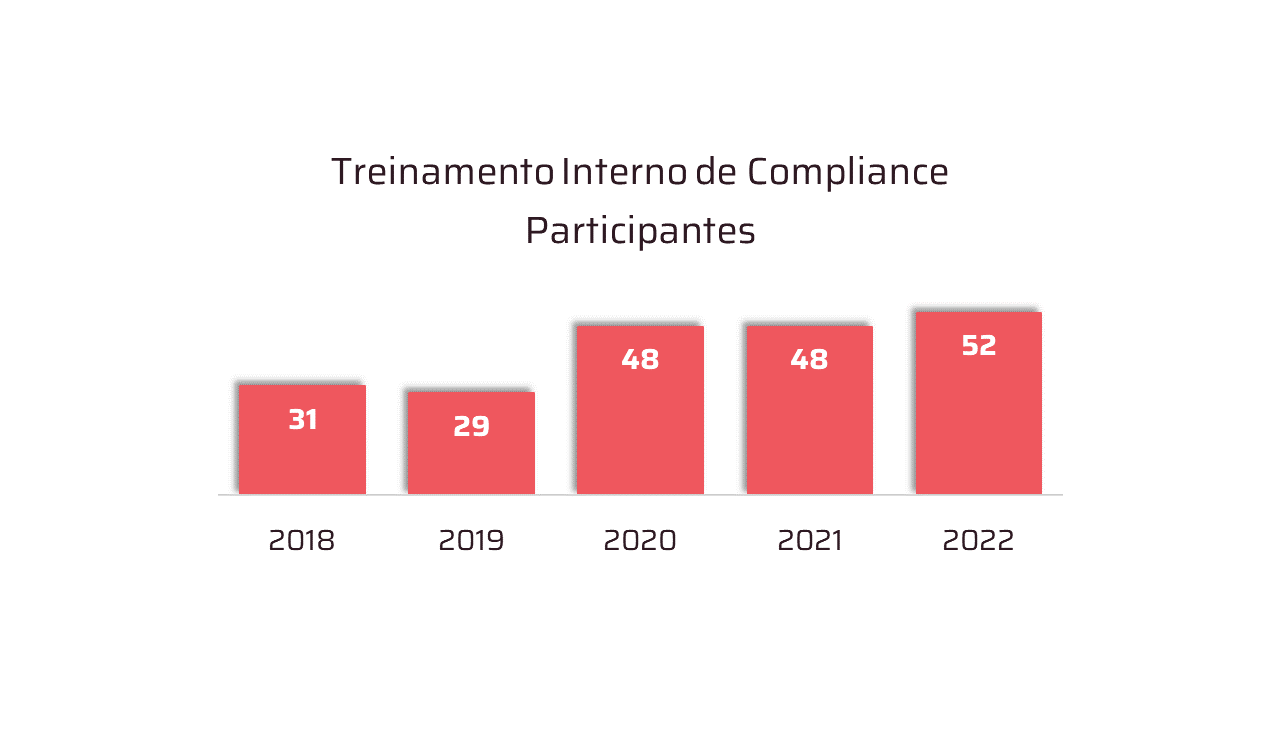
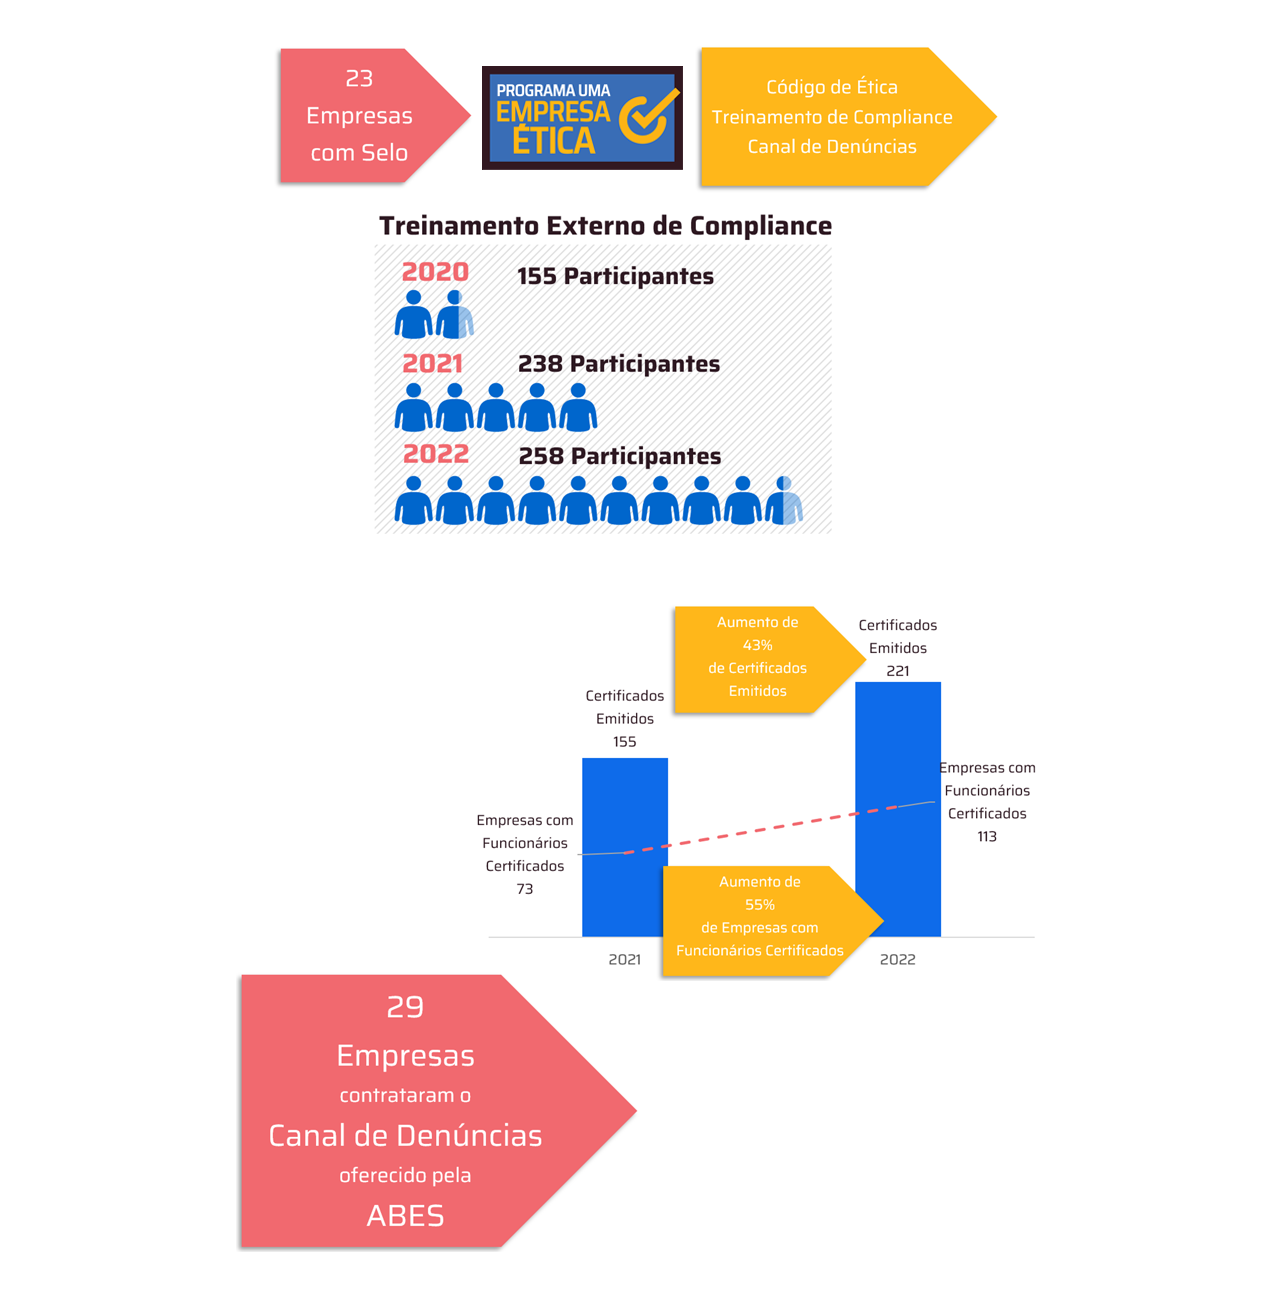
Below, check the charts with the main indicators of the study. For the full study, go to the website.