Carried out by datatech, the “Identity and Fraud Report 2024” was released at FEBRABAN Tech and is available for download
Four out of every 10 people have suffered fraud in Brazil (42%). Of these, 57% suffered a financial loss of R$ 2,288 on average, that is, almost a month and a half of work for those earning a minimum wage. For companies, concern about the recurrence of scams increased by 58% in one year. These and more data are present in the “Digital Identity and Fraud Report 2024”, developed by Serasa Experian, a datatech leader in intelligence solutions for analyzing risks and opportunities, focusing on credit journeys, authentication and fraud prevention. Published at FEBRABAN Tech, the material is available for download, clicking here. 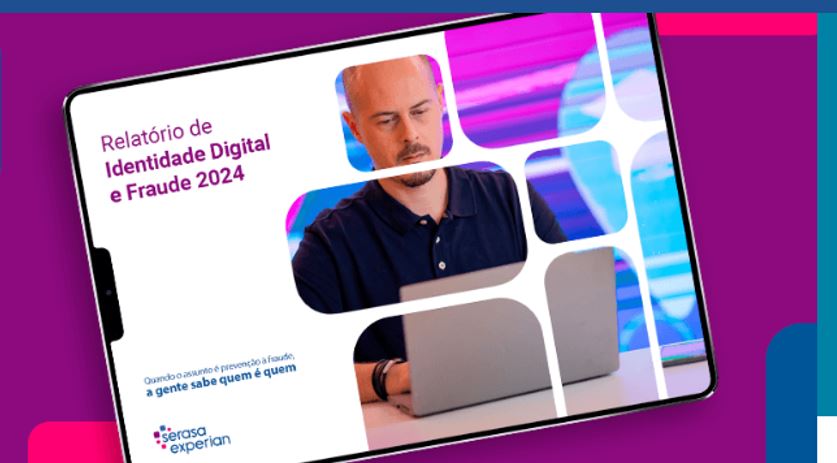
“Technological advancement is an irrefutable gain for everyone, but, to the same extent, criminals also improve to take advantage of consumer loopholes, in addition to the systems that companies eventually leave behind. Both consumers and businesses must be vigilant and use all available tools to protect their information and transactions. As there is no silver bullet that shields each and every transaction, only layered protection is capable of guaranteeing everyone's security. Some examples are facial biometrics, device risk analysis, document verification, 'Know Your Costumer' Registration (KYC), among others. Continuous monitoring, multi-factor authentication and the intelligent use of technologies are essential to guarantee the integrity of operations, sustainable business growth and, at the same time, prevent fraud”, explains the Director of Authentication and Fraud Prevention at Serasa Experian, Caio Rocha.
View of consumers (individuals) on fraud
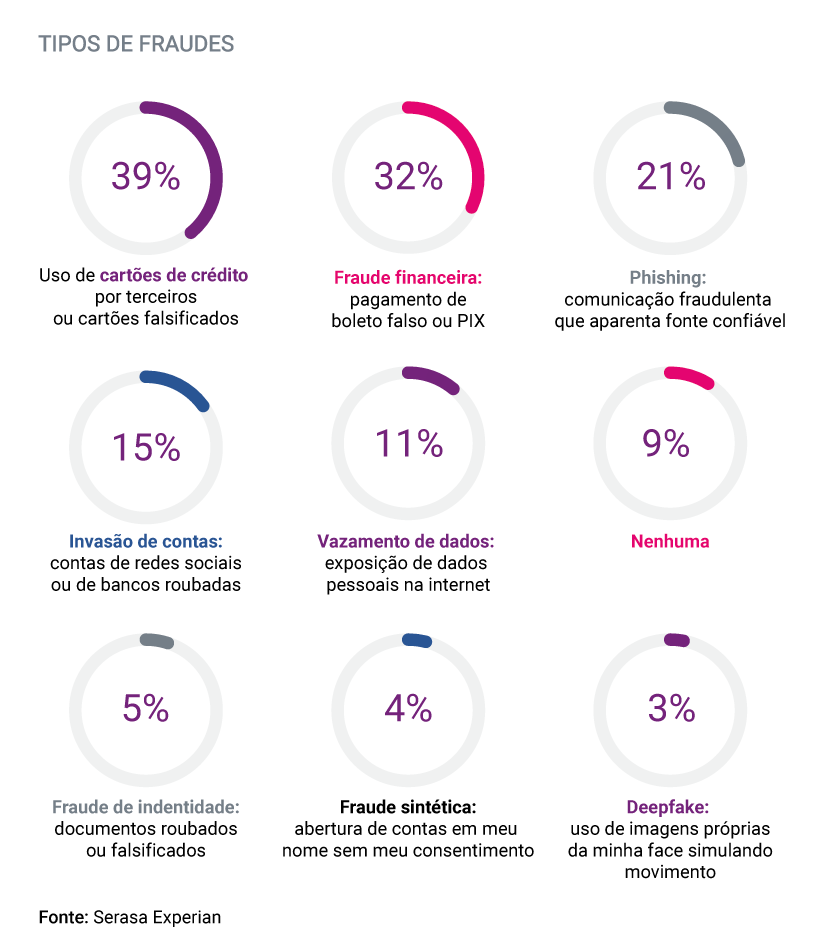
The types of scams most reported by consumers were “use of credit cards by third parties or counterfeit cards” (39%). See the following graph for details of the types of fraud identified by the study:
Respondents also said that 26% of the frauds they suffered happened in 2022 and 31% before that. In relation to the diligences carried out in 2023, 10% were in the first quarter, 9% in the second and 15% in the third.
Also according to data from the study, after suffering fraud, 87% of the respondents said that their concern about the issue “increased”. The percentage goes to 91% when considering the group of people who suffered financial losses.
Profile of fraud victims
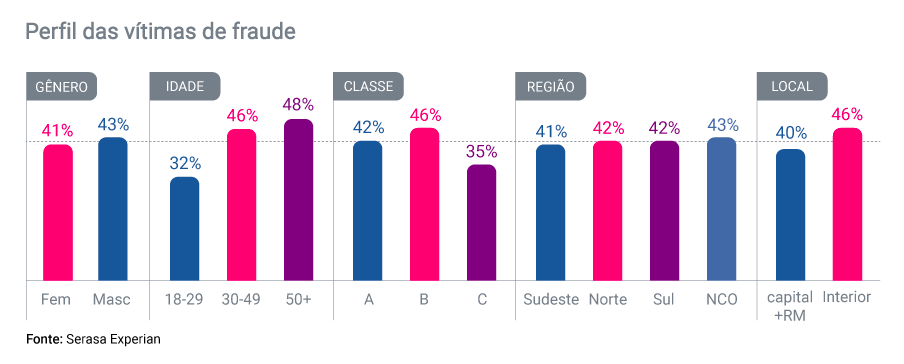
According to the research, of the total 42% of people who suffered fraud, the percentage grows more in class B, where the same rate reaches 46%; and decreases in class C, which has a rate of 35% of people identifying themselves as victims of scams. Caio Rocha explains that “criminals target Brazilians with greater purchasing power to increase their earnings, but fraud occurs in any income range”. When we look at the differences in the rate by age group, the study found that those 50+ appear to have the highest fraud rate (48%). There are no significant differences between the regions of Brazil, but there is a higher rate of victims in the interior (46%) than in the capitals and metropolitan regions (40%). Check out all the detailed data from this vision in the infographic below:
Most feared scams
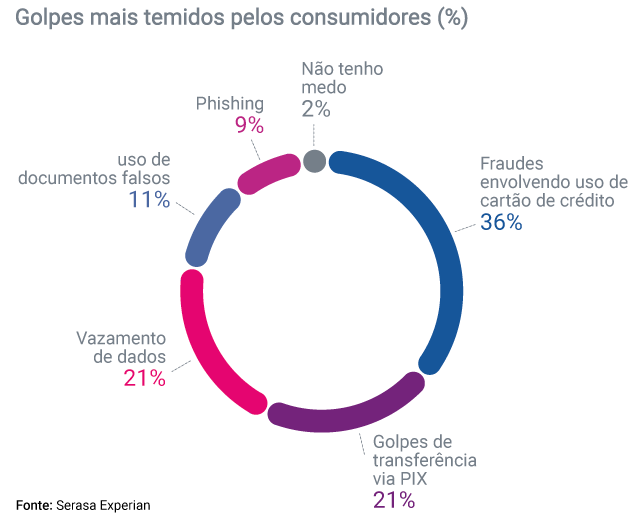
Fraud with payment methods and data leaks are the most feared by people and only 2% said they are not afraid of being scammed. See the complete survey of this vision in the graph below:
View of companies (legal entities) on fraud
The “Digital Identity and Fraud Report 2024” also sought to hear from companies about scams and 58% of companies state that concern about this topic increased between 2022 and 2024. The increase was even greater when viewed by size: with large companies, this index rises to 68%. They are even the most aware of the importance of preventing criminals: “Protection from Fraudulent Operations”, in 2024, is the second focus of companies (35%), behind only “Conquering More Customers” (45%).
Regarding the general growth of concern about fraud, the survey indicated that there was an impact on the budget forecast of the companies interviewed, changing the priority of spending on fraud from fifth place in 2022 to third in 2024.
See below the complete investment ranking by areas: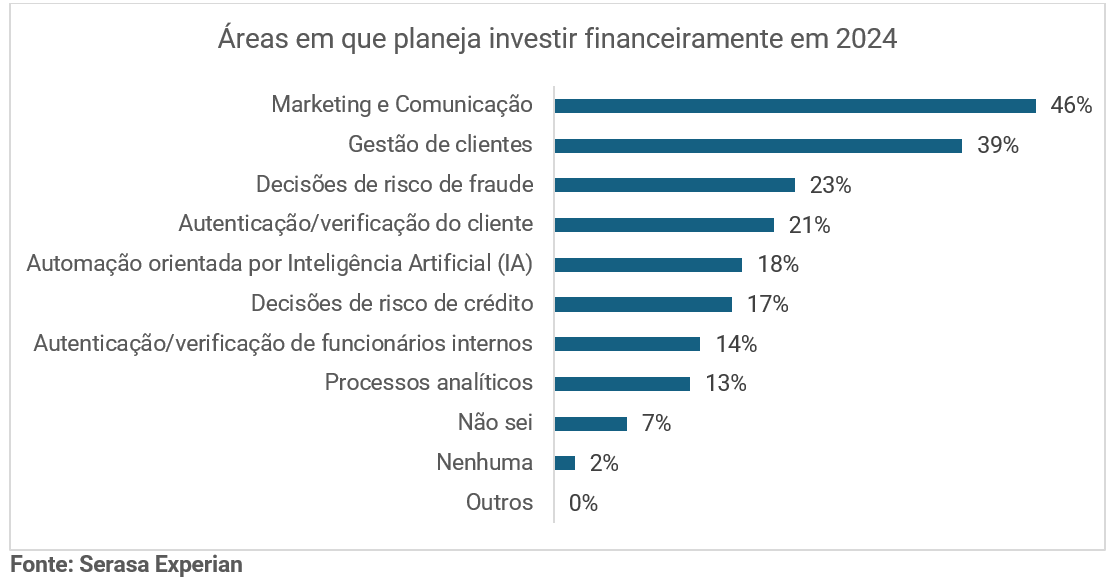
When suffering some type of fraud attempt, companies expressed concern about issues related to information security, mainly “Customer Data Leakage” (49%) and “Financial Losses” (48%), followed by “Own Data Leakage ” (39%), “Default” (35%), “Theft of Strategic Information” (34%), “Identity Fraud” (28%) and, finally, “Loss of goods” (16%).
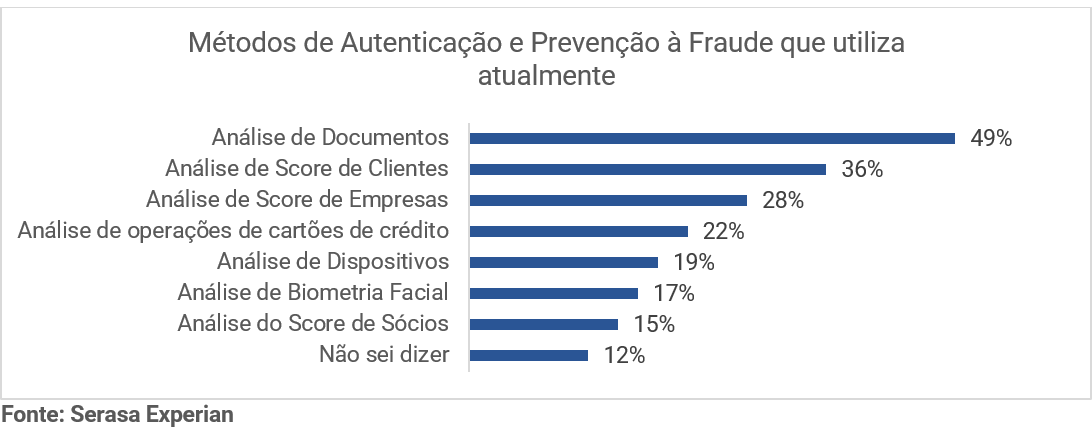
Attention to all layers of protection
To prevent fraud, the research also revealed that companies consider the layers of protection essential, the main ones being “Document Analysis” (49%), “Customer Score Analysis” (36%), “Score Analysis of Companies” (28%), “Analysis of credit card operations” (22%) and “Device Analysis” (19%). Check out the complete ranking:
Methodology
INDIVIDUAL VIEW
804 interviews were collected via online panel between the 7th and 22nd of November 2023 with individuals, of which 45% are from the Southeast region, 26% from the Northeast, 15% from the South, 8% from the North and 7% from the Central-West region and 51% are men and 49% women.
The majority of respondents belong to Class B (50%), followed by Class C (32%) and Class A (18%). Regarding age range, the survey was also quite comprehensive, with 26% of respondents being 50 years old or over, 22% between 30 and 39 years old, 20% from 18 to 24 years old, 19% from 40 to 49 years old and 13% from 25 to 29 years old.
The study's margin of error is 3.5%, with a confidence interval of 95%.
LEGAL ENTITY VISION
331 legal entities (PJs) participated in the interview, considering the classification established by SEBRAE, of which 49% are from the Southeast region, 20% from the Northeast, 16% from the South, 9% from the Center-West and 6% from the North. The research took place between November 7th and 27th, 2023 and sought to cover several sectors, including commerce, services and industry, as well as companies operating in both the B2B and B2C markets.
Of the total number of responding companies, 71% are “private and national”, 16% “private and multinational” and 13% “state-owned”. In relation to the companies segment, 60% are from “Services”, 18% from “Retail Trade”, 5% from “Wholesale Trade” and 5% from “others”. The size of the companies was divided into “Micro” (37%), “Small” (21%), “Large” (16%), “Over 1,000” (15%) and “Medium” (12%).
The study's margin of error is 5.4%, with a confidence interval of 95%.