The Terms and Conditions described here are intended to inform the User of the conditions of use of the platform made available by ABES - Brazilian Association of Software Companies (ABES) registered with the CNPJ under number 57.004.897/0001-49, called " Technology Education Hub” (“Platform”).
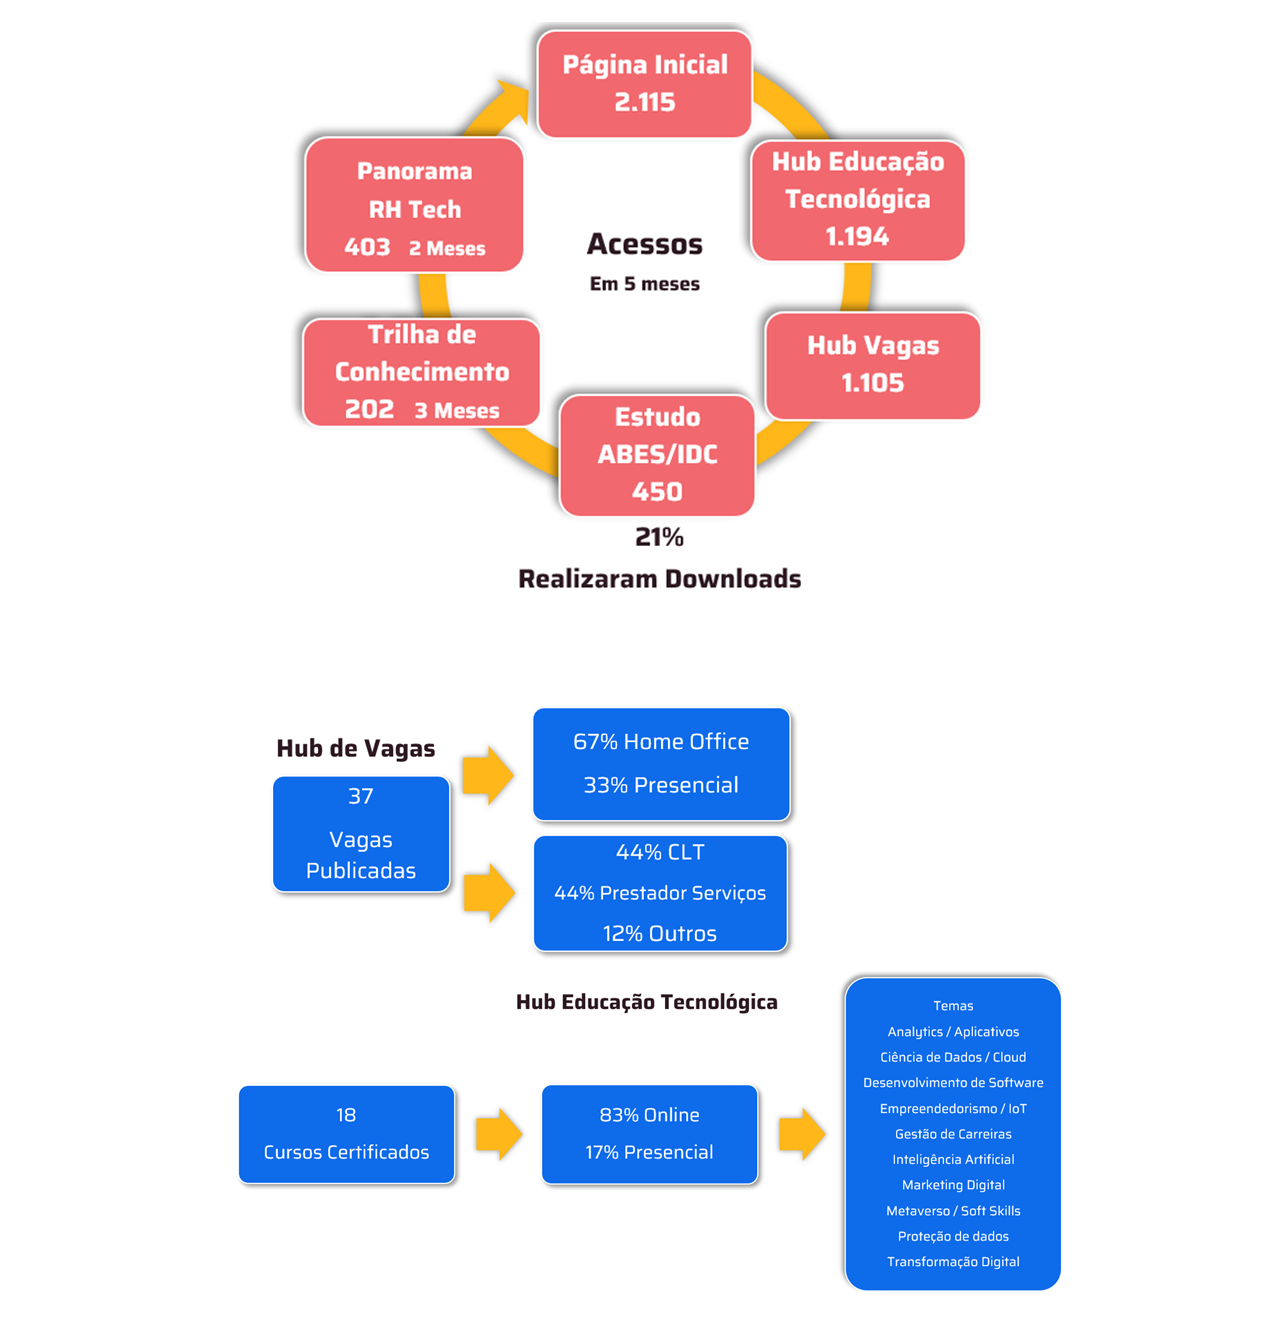
The Platform aims to be a hotsite for the dissemination of courses and training offered by ABES member companies and partners, in order to facilitate access to qualified training offers in the area of ICT (Information and Communication Technology), contributing to the training talents that can meet the growing demand for professionals in the sector.
By accessing this hub, the User will be able to check the range of courses available and will be directed to the company/partner's website so that they can obtain more information and register.
ABES clarifies that it has no participation in the elaboration or offer of courses and does not receive any financial advantage with this disclosure, providing only to the User, access to the Platform, with the courses available by the associated companies and partners of ABES.
The User is aware, accepts and agrees that the information and content of each course available on the Platform is the exclusive responsibility of the company providing this content, and may be an associate or partner of ABES, so that the User will be subject to the contracts, terms and policies made available by these companies. Any questions, complaints or suggestions should be directed to them, through the means of contact indicated in the course announcement.
ABES uses cookies and similar technologies that are necessary for the proper functioning of its Portal, for statistical purposes in order to better understand the profile of visitors and their interests when browsing our pages. The data collected is treated anonymously. Visit our “Cookies Policy", to know more.
The User undertakes to use the Platform in accordance with these Terms and Conditions and in full attention to current legislation, public order and other applicable regulations, and the User undertakes not to use the Platform to carry out illegal activities, fraudulent, that violate the rights of third parties and/or that violate the intellectual property and copyright of third parties, or any other current regulation.
Upon your electronic acceptance, the terms contained in these Terms and Conditions are effective as of the date of such acceptance.


